By Jackson Howarth
Wed, 7 Jan 2026 01.50 GMT
Article
Deferring grid upgrades with dynamic distribution grid pricing: SSEN reference case
Distribution grid operators need to get more out of their grid infrastructure, especially as demand rises and demand patterns become more complex. If demand from new grid-edge DERs is flexibly managed to avoid constraints on the network, we may be able to avoid or defer the need for costly distribution grid infrastructure upgrades for 10+ years.
Through a pilot with British distribution network operator (DNO) Scottish and Southern Energy Network (SSEN) – using Kraken’s grid management platform – we project that grids should be able to get more from existing infrastructure by using “dynamic distribution grid pricing” to encourage energy use at times that benefit the grid, especially from smart assets (in this case we have focused on electric vehicles – EVs).
Projected Savings:
From this initial trial (focused on exposing EV owners to dynamic distribution grid pricing around 4 Scottish primary substations), we project that such pricing has the potential to unlock the following benefits across the distribution grid in question, which has 1,000 primary and 70,000 secondary substation (see CAPEX methodology below).
- +10 years of CAPEX infrastructure deferral
- +25% of peak load reduction
- >100GWh per year of maximum energy shift
- ~£1Billion cost savings.
The problem: demand growth and complexity
Today’s distribution grids are serving an unprecedented demand increase, driven by electrification and data center load growth. In addition, demand patterns are becoming more complex and dynamic, and so increasingly difficult for grid operators to plan for and manage. Across the network, increasing volume and complexity of demand is outpacing current network capacity. Mismanaged demand risks network losses, reduced efficiency, damage to the network, and even damage or malfunction of consumer devices. This is driving network operators to start planning for — and deploying — billions of dollars of network infrastructure upgrades (poles, wires, transformers, substations) to keep pace.
One major driver of load growth today is the proliferation of customer-owned distributed energy resources (DERs) such as EVs, batteries, and heat pumps. Left unmanaged, without insight into how the timing or location of their usage impacts the network, these devices could strain local grids. However, many of these devices can be flexibly managed, shifting usage away from times when the network is near capacity.
The cost to serve an incremental unit of demand on the distribution network varies significantly by time and location, yet operators often continue to use fairly rigid pricing. Some European countries use time-of-use double tariffs (high and low), indicating higher grid price during the day and evening and lower price at night. In the UK, distribution grids use a rigid, three stage, time-of-use tariff (RAG: Red, Amber, Green).
The solution: dynamic distribution grid pricing
Kraken was recently involved in a UK-based trial to explore the consequences of pricing the network to more accurately reflect cost variability of serving demand. Distribution system operator Scottish and Southern Electricity Networks (SSEN), alongside supplier Octopus Energy (leveraging Kraken’s grid and flexibility capabilities) implemented a trial, which looked at grid congestion at a specific point in the distribution network (around Dundee, in Scotland), and reflected this in a day-ahead dynamic grid tariff to encourage the shifting of flexible loads.
How exactly dynamic grid pricing might be implemented varies, but this reference case holds valuable learnings for energy systems of various shapes and sizes, benefiting energy retailers and “distribution system operators” in deregulated markets such as those across Europe, as well as vertically integrated distribution utilities in the US.
How did the trial work?
- First, we used available grid topology and telemetry data to create a real-time visibility around four substations in Dundee, Scotland.
- We trained a forecasting model using Kraken’s grid capabilities, using grid visibility data to forecast power flow and congestion around those substations.
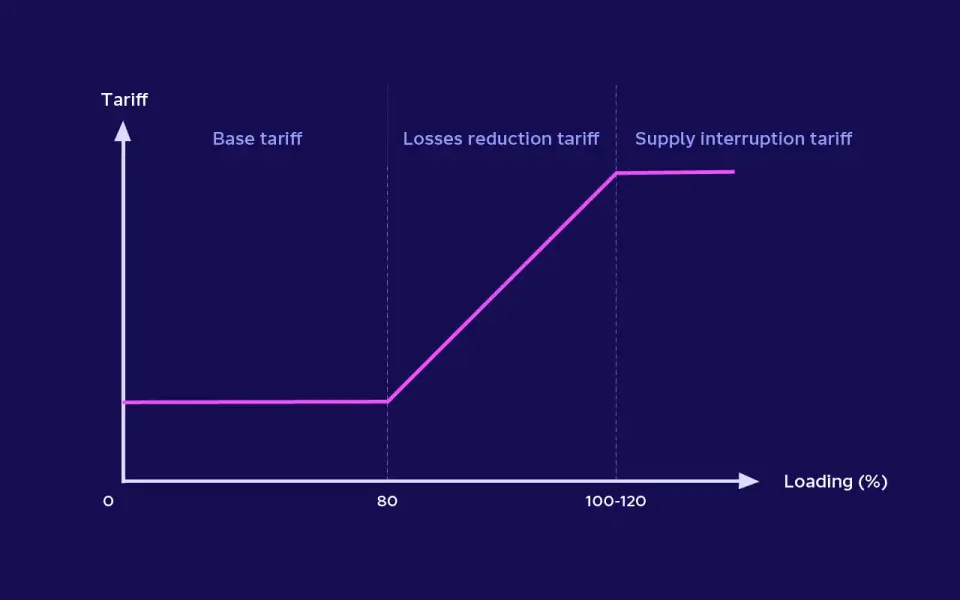
- We then converted forecasted loading into a price, using a loading-price curve. The specifics of this price curve can be defined by the grid operator. This trial used a curve with three parts:
- A low price for loading below 80%;
- A variable price, which increased in line with loading between 80-120%; and
- A high price for loading above 120% corresponding to the supply interruption and value of lost load.
The loading-price curve
- To simulate a change in grid pricing, this variable price was added on top of the existing tariff structure to form the “dynamic distribution grid price.”
- The supplier, Octopus Energy, then put EV drivers around these substations on a bespoke EV charging tariff, which automated and optimized charging in line with the dynamic distribution grid price. Octopus leveraged Kraken’s platform to rapidly and robustly build the pricing mechanism, and design bespoke rates.
- We measured the impact of having EVs respond to the dynamic distribution grid price.
Network load around substations with dynamic price signals (top) vs control group (bottom)
Responding to dynamic prices: optimizing around customer preferences. Network loading across “Dundee 5” versus control group. The bottom graph in the image above shows the control group: vehicles would have charged at this time if not exposed to this dynamic price.
The graph above shows we were able to reduce load roughly in half, while only charging the cars that needed to be charged at this time to meet pre-specified customer preferences.
Implications for integrated utilities
In British or European-style deregulated systems, we might assume that the distribution grid operator would pass variable grid tariff pricing on to retailers, who would then choose how to pass these prices on to end-customers.
For vertically integrated systems, such as in the US, dynamic grid pricing could unlock similar benefits, though the process could be more direct. The utility, presiding over both the distribution network and customer interactions, would both determine the grid tariff, and how to expose network users. For example, they could choose to expose all customers to those rates directly, effectively putting all customers on time-of-use rates, or they might choose to expose customers with flexible DERs, and use a platform like Kraken to automate overnight EV charging, for example, in line with those rates.
This trial — and our subsequent projection — suggests that it is possible to reduce congestion by using dynamic grid pricing to encourage, or nudge, flexible consumers with DERs (shown here with EVs) to increase or decrease load. Critically, Kraken’s role proves that the necessary technology is available today to pass dynamic grid pricing on to customers. This can help utilities maximize current distribution network capacity, avoiding or deferring the need for network infrastructure investments.
Methodology
We created 6 groups of EVs, each responding to a different network price. We focused on four monitored primary substations with ~10 EVs each, an aggregated Group (synthetic price of all primary substations) with around 70 EVs, and a control group (with 110 EVs elsewhere in the UK):
Group 1 - Primary 0003 (Menzieshill) - EVs: 11
Group 2 - Primary 0014 (Macalpine Road) - EVs: 9
Group 3 - Primary 0033 (Rosebank Street) - EVs: 9
Group 4 - Primary 0057 (Broughty Ferry) - EVs: 9
Group 5 - Dundee aggregated - EVs: 72
Group 6 - Control group of 110 EVs
As mentioned above, we used available grid topology and telemetry data to create a real-time visibility. We then converted forecasted loading into a price, using a loading-price curve defined by the grid operator. This trial used a curve with three parts:
- A low price for loading below 80%;
- A variable price, which increased in line with loading between 80-120%; and
- A high price for loading above 120% corresponding to the supply interruption and value of lost load.
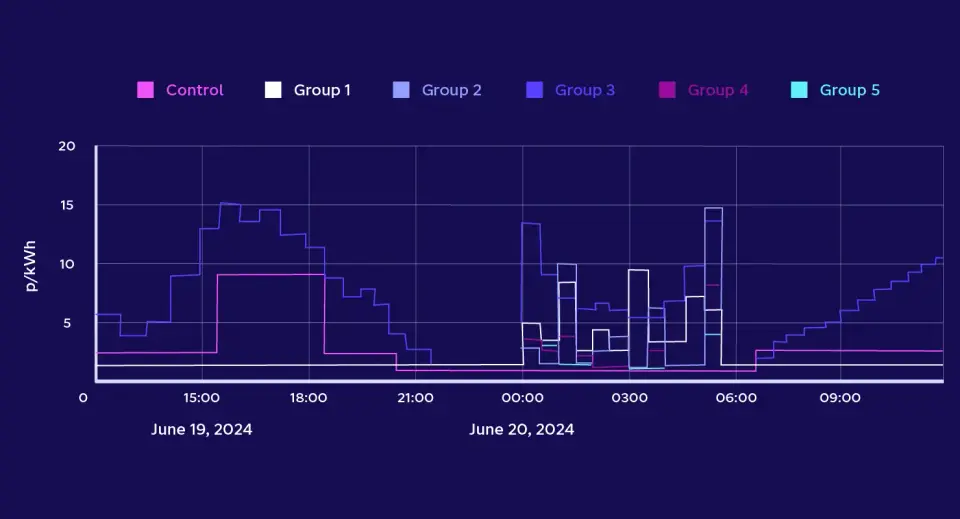
Each group (colored) received a different price signal for their dynamic prices depending on local network conditions as forecasted via Kraken’s grid technology.
A control group was used to respond to the original price signal. All signals were sent from Kraken’s grid technology to Kraken’s flexibility technology for the optimization of assets.
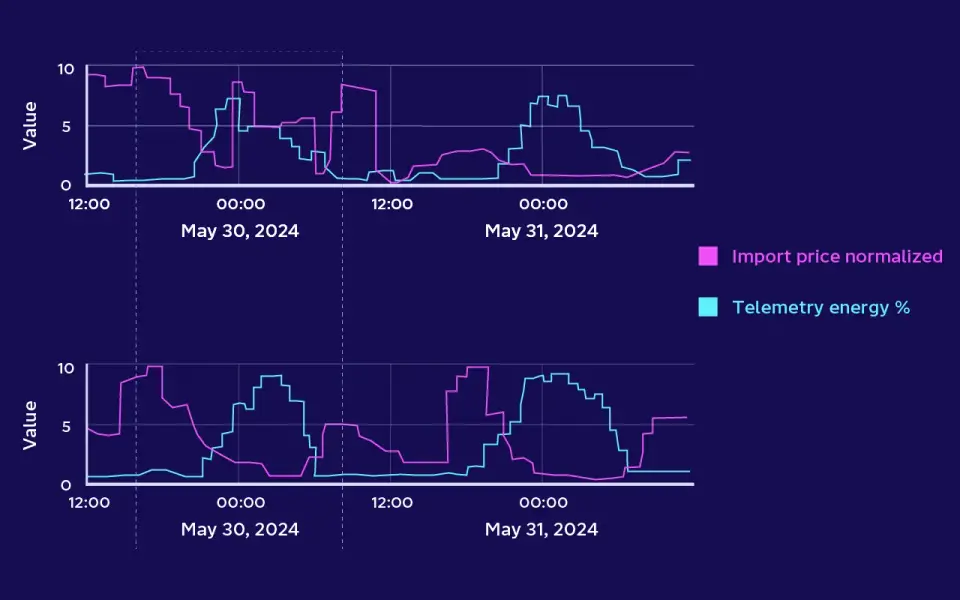
Responding to dynamic prices at the "Dundee 3" substation (top) vs control group (bottom).
Here, the blue line shows the Kraken-constructed price signal from the exposed group (top) versus the control group (bottom).
The top group was shown a high price at midnight reflecting network constraints, whereas the control group was not.
The green line shows vehicle telemetry. In this case, we were able to completely avoid the high congestion times by turning off charging and shifting load to other times (green peaks around the network congestion).
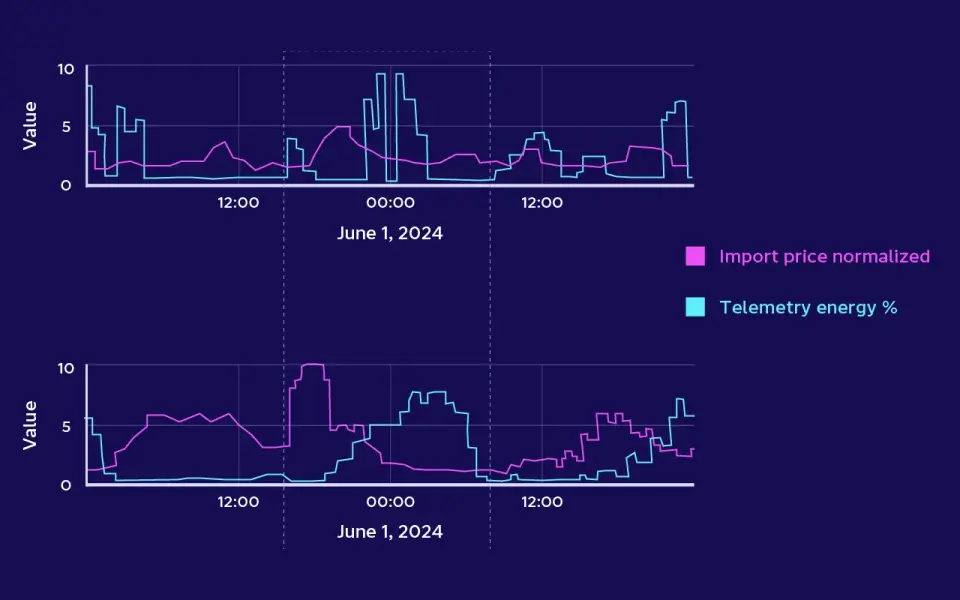
Network load around substations with dynamic price signals (top) vs control group (bottom)
Responding to dynamic prices: optimizing around customer preferences. Network loading across “Dundee 5” versus control group. The bottom graph in the image above shows the control group: vehicles would have charged at this time if not exposed to this dynamic price.
The graph above shows we were able to reduce load roughly in half, while only charging the cars that needed to be charged at this time to meet pre-specified customer preferences.
As mentioned above, at a different substation on a different day, we were able to reduce load roughly in half, only charging the cars that needed to be charged at this time to meet customer preferences.
CAPEX deferral methodology
To compute the potential CAPEX deferral figure (10+ years) the following assumptions have been used:
- 1,000 primary substations, of average rated power 15MVA and average utilization of 50%. This utilization assumes that existing EVs are inflexible.
- 70,000 secondary substations, of average rated power 500 kVA and average utilization of 40% (considering current operational EVs).
- This CAPEX deferral is calculated based on savings around primary and secondary transformers. It does not include savings around the potential cost reinforcement for lines (underground or overhead).
- Inflexible load grows yearly at 4%.
- The number of EVs grows yearly at 7%.
- On average, we assumed that all EVs have a 7 kW charger, 60 kWh battery capacity, and start with 40% and finish at 80% of charge (average number based on Kraken data).
- All operational EVs have optimized, automated, flexible charging (as EVs did during the trial laid out above).
- For primary substations, the capacity cost for reinforcement is 100 £/kVA while for secondary substations it is 150 £/kVA.
- A capacity reinforcement is expected to last for 40 years.
The computation for the projected deferral time accounts both for primary and secondary substations, and it is based on the computation of the power headroom of the substation transformer. This is, when the transformer’s capacity is exceeded (in other words, there is 0 or negative power headroom), there is the need for investing in new infrastructure.
Moreover, this negative power headroom reflects the additional capacity that would be needed to avoid overloading the transformer.
The computation is performed for two scenarios:
- Inflexible scenario: where all loads, base load and EVs, are inflexible.
- Flexible scenario: where the base load is still inflexible, but the 100% of the existing EVs is considered flexible, i.e., they can modulate their power according to the power headroom during the time they are connected.
For the flexible scenario, the power headroom considers that, instead of charging the EVs at full power, they can shift their energy consumption to time periods where there is more headroom.
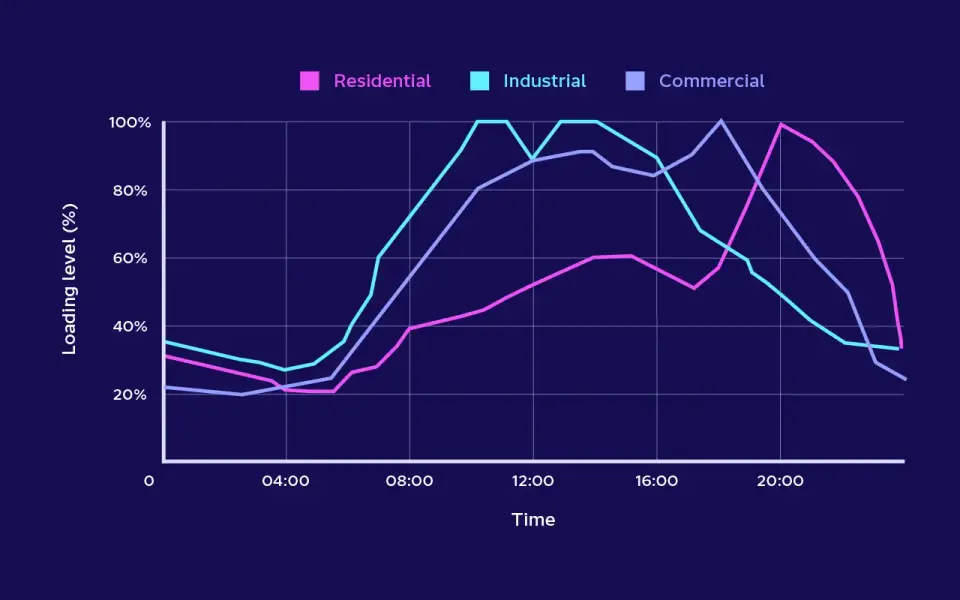
To this end, typical load profiles for medium-voltage and low-voltage feeders for European distribution grids are considered:
Daily load for primary substations
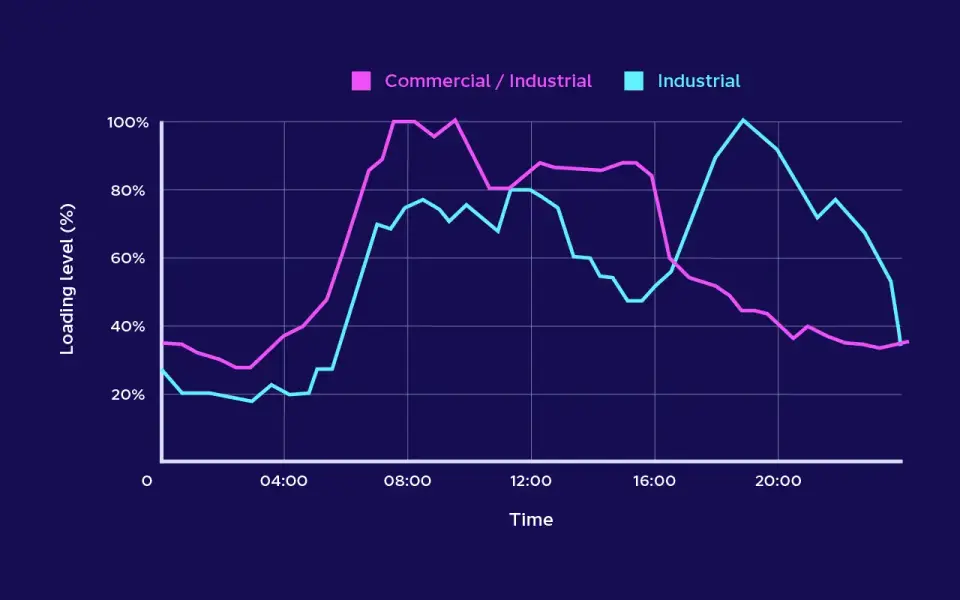
Daily load for secondary substations

These expressions consider that, when there is enough headroom below the maximum load power, then the transformer power headroom will depend only on the load power. In the opposite case, namely when there is no space below the maximum load power, it is the EVs that increase the maximum power, and the resulting additional power is the average power needed to fulfill the remaining energy demand from EVs.
As a result of this computation, the peak reduction and maximum energy shift are computed on a yearly basis.
Then, the overall results are computed as follows:
Years of CAPEX deferral is the amount of additional years the usage of this technology could defer in reinforcing the system.
Peak load reduction is the average peak reduction (i.e., (peak without flex - peak with flex) / peak without flex) that can be reached.
Maximum energy shift refers to the largest amount of energy shifted over one year across the entire system to avoid capacity violation.
Cost savings corresponds to the amount of money that is not spent on additional power-capacity needed before the flexibility cannot avoid violating the transformers’ rated power. For this computation, it is assumed that a grid reinforcement will last for Y years, then the savings are computed as:

To calculate overall savings, we then added up the component per substation, where substation type (primary and secondary), and the profile type (residential, industrial, and commercial) are considered.